Lumiun's new reporting module helps you save time and find information that can be very useful for network security and employee productivity.
Millions of data points pass through Lumiun every day. With this in mind, we created this new reporting tool to transform data into valuable insights that can help managers and those responsible for the company's network make decisions. In addition to all the benefits, this new feature is available for all plans: Professional, Corporate, and Enterprise.
In this article, you'll learn about the main features so you can start using it!
Ready reports
When you access the Lumiun reports page, you'll find a few fixed options divided into three data sources: DNS Access, Firewall, and Traffic Speed. All reports can be filtered to obtain more detailed and clear information. Additionally, reports can be exported to PDF or CSV.
Check out some of the ready-made reports:
DNS Accesses: Sites Accessed
This report allows you to monitor all website accesses on your network in real time
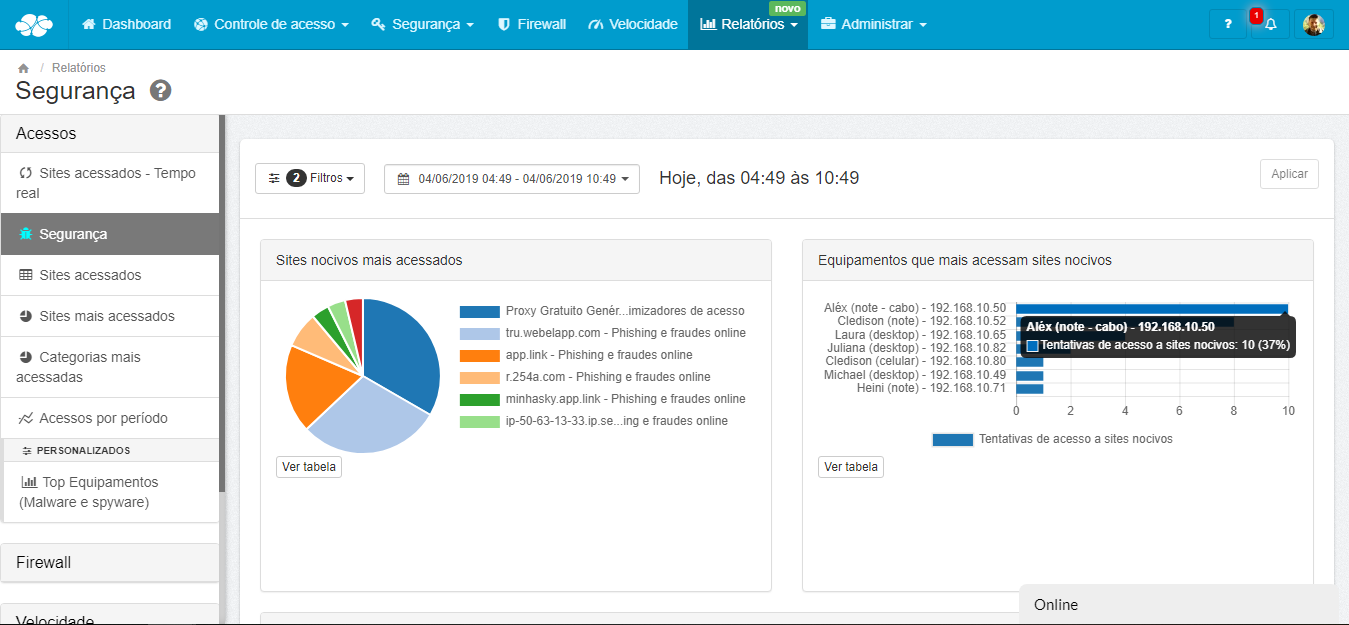
DNS Access: Security
This security report provides data on attempted access to malicious websites and which devices are making the most requests. This allows you to identify devices infected with malicious software and block access using Lumiun's security tool.
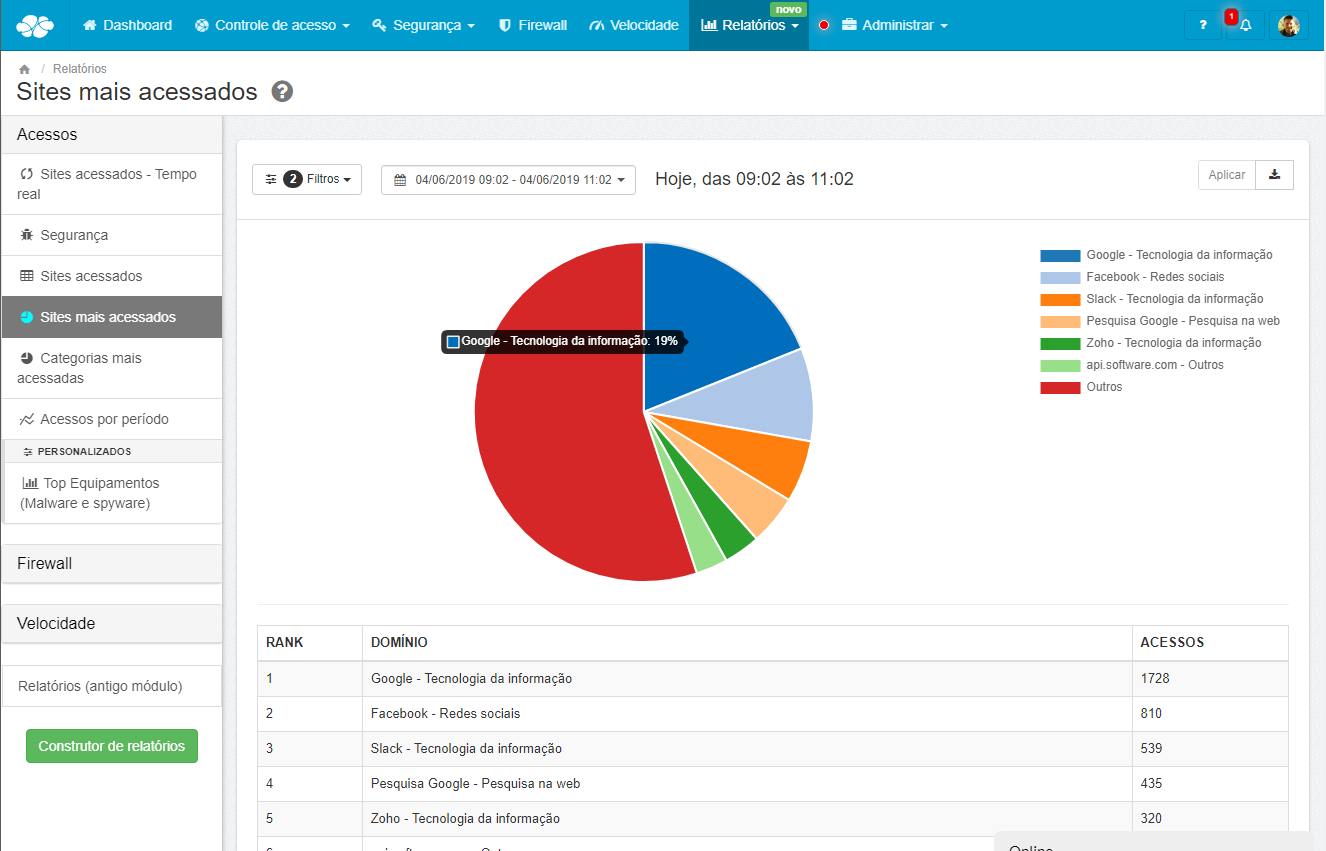
DNS Accesses: Most Accessed and Blocked Categories and Sites
These reports display, through graphs and tables, the ranking of the most accessed and blocked categories and websites over a given period. For example, we can apply a filter and identify accesses and blocks individually by device, user, group, and category.
Traffic speed
The traffic speed report displays a line graph with information about the download and upload speed used over a given period.
Report Builder
In addition to pre-built reports, we've made available a new tool called " Report Builder ." With this tool, you can:
- Create a custom report based on the information you want.
- Schedule the period to generate the report: Daily, Weekly or Monthly.
- Set the email to receive notification of the completed report.
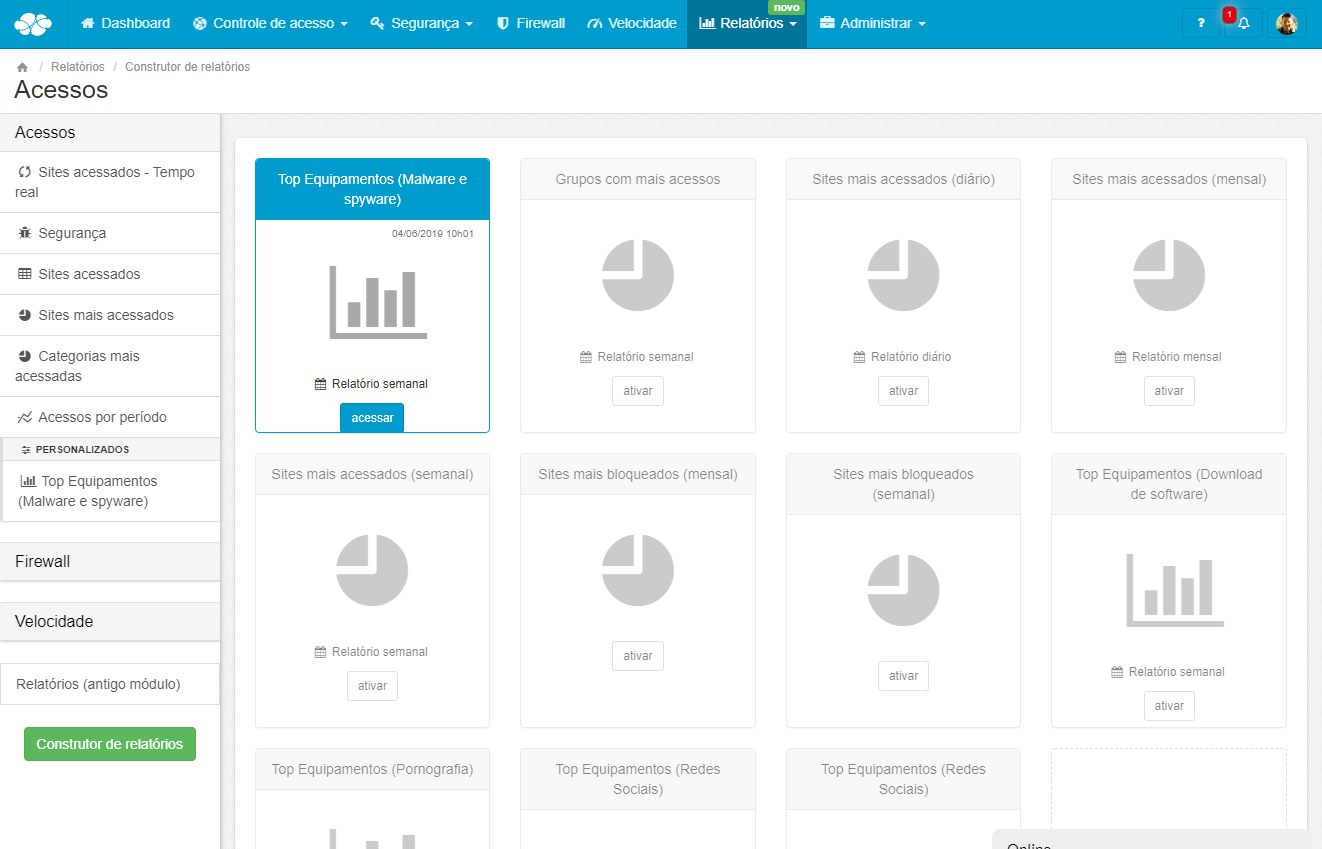
Custom Report Gallery
To make things even easier, we've created a gallery of customized reports that generate useful information for managers' decision-making.
See the list of reports you can now activate:
- Groups with the most visits this week
- Most visited sites per day, week and month
- Most blocked sites by day, week and month
- Devices that access the most websites in the “Software Download” category this week
- Devices that access the most websites in the “Pornography” category this week
- Devices that access the most websites in the “Social Networks” category this week
Discover all the features
If you want to learn about all the features and make the most of the new reporting module, just access the various content we have available in our Help Center .
Now, if you're not yet a customer and want to see how Lumiun reports work in practice, fill out the form below to request a no-obligation demo!